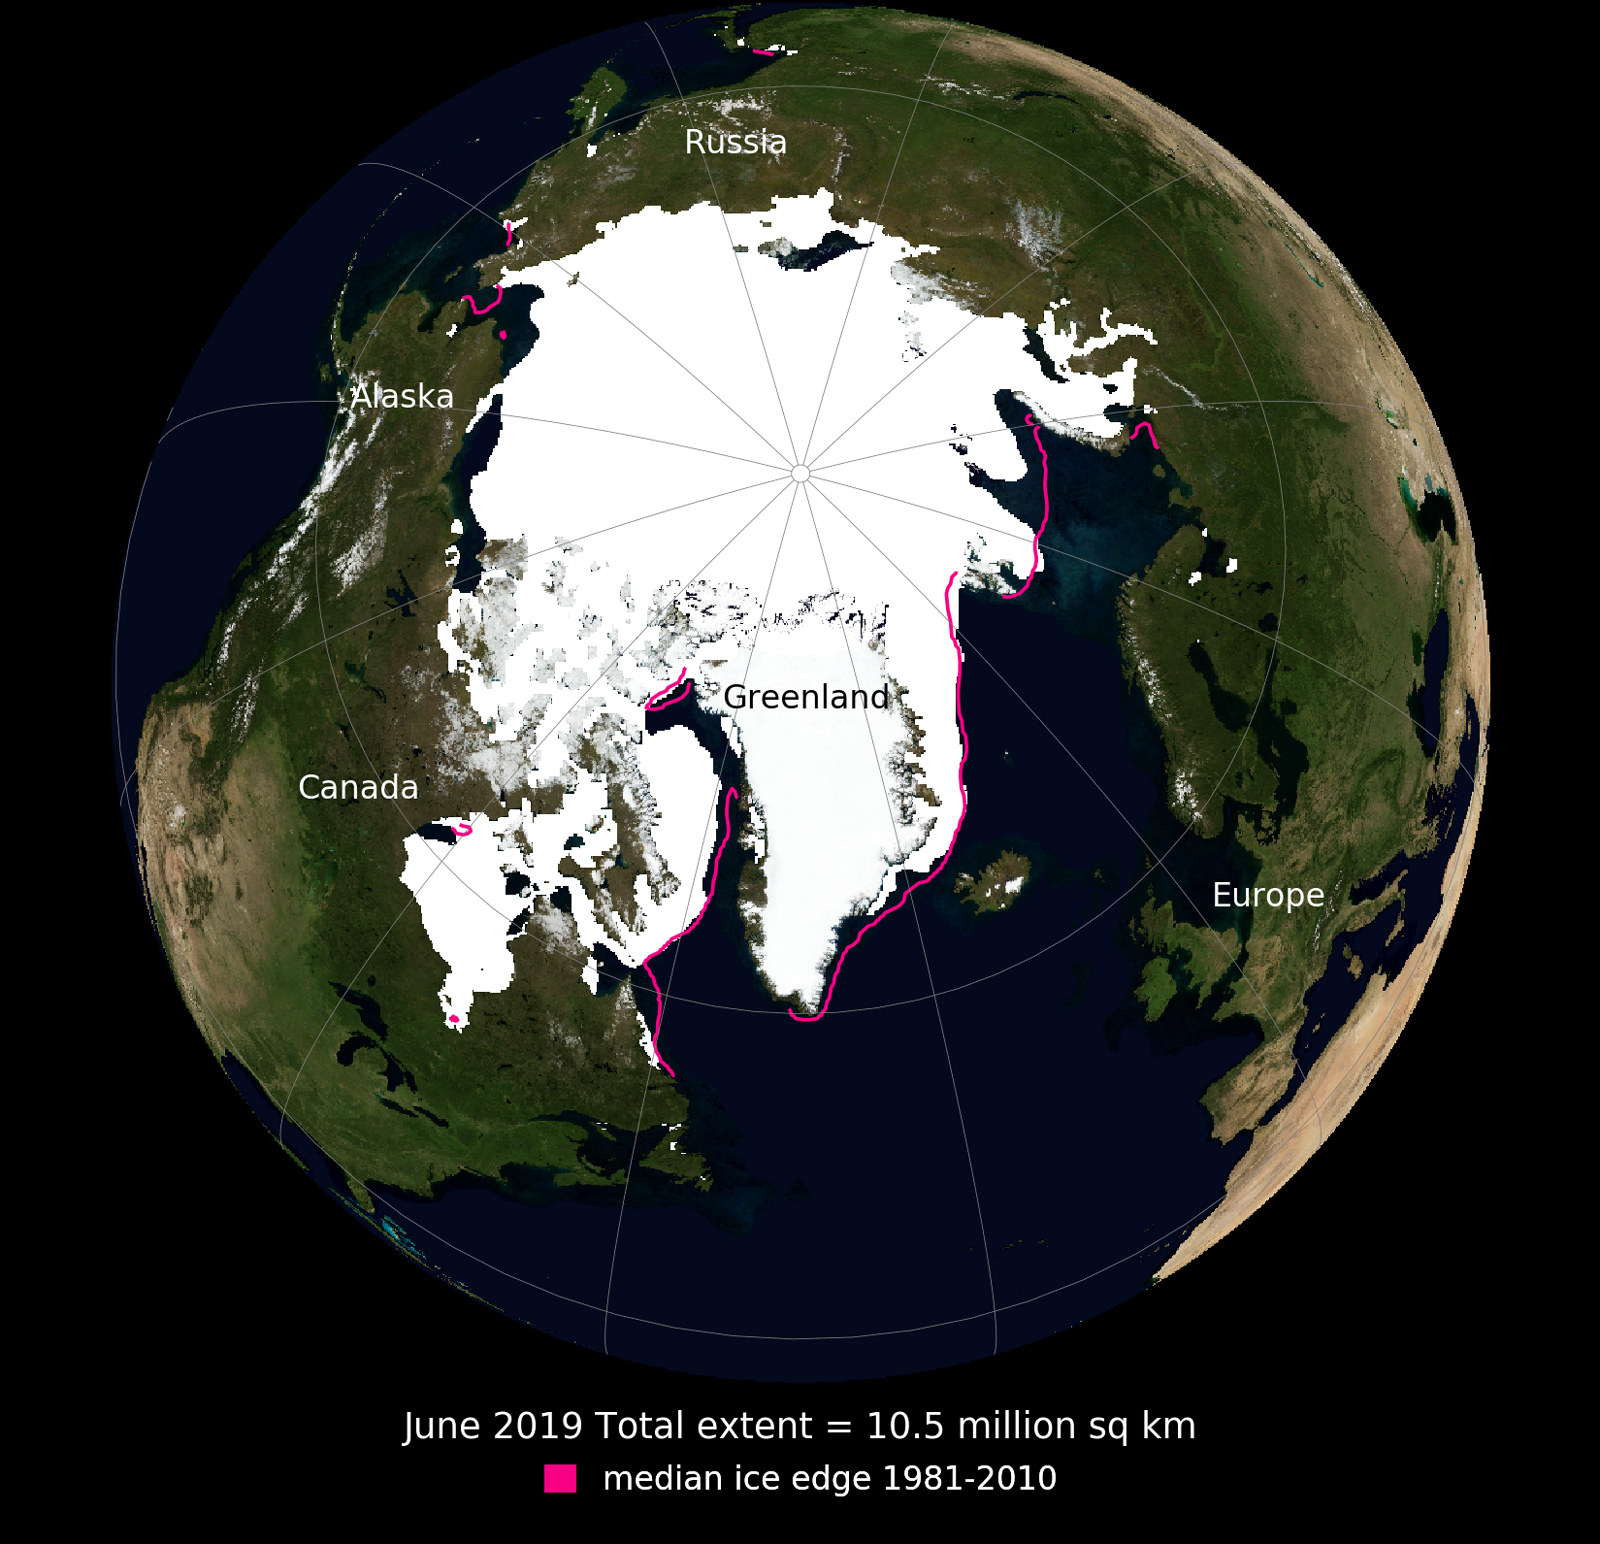
The average extent of sea ice in June 2019; pink line shows the median position of the ice edge from 1981 to 2010.
Satellites are watching for an unwelcome record at the very top of our warming world: In the next few weeks, we could see a new low for the area of sea ice in the Arctic Ocean.
Each year, the low for sea ice arrives around mid-September after the long summer melt. The previous record — by some margin — was in 2012. Right now, this year’s melt is proceeding even faster, as the chart below shows.
The values shown are a five-day rolling average. Hover or tap on the chart to compare 2012 and 2019; other years from 1979 onward are shown in light gray. The chart will automatically update each day.
The loss of sea ice is particularly bad news for polar bears, which range across it to hunt their seal prey.
But it could also make life tougher for us all, by accelerating global warming. As white ice is replaced by darker water, less of the sun’s energy will be reflected back into space, further warming the world and likely disrupting patterns of ocean circulation.
It’s no surprise that 2019 is shaping up to be an exceptional year for sea ice loss. We have already experienced the hottest June across the globe ever, and July is expected to be the planet’s warmest month on record.
Still, experts say that it’s unclear whether the 2012 record will be broken. “There’s a pretty big variation in the trajectory it can take from here,” Walt Meier, a member of the team that tracks sea ice for the National Snow and Ice Data Center in Boulder, Colorado, told BuzzFeed News.
As you can see from the chart above, 2012 was unusual in that a steep decline in the area covered by sea ice continued well into August, rather than starting to level off from the end of July. In part, that was due to a strong storm that formed off the coast of Alaska on Aug. 5, 2012, and then shifted to the middle of the Arctic Ocean. As it did so, it helped break up the sea ice, contributing to the record set that year.
The lowest area of Arctic sea ice in each year since 1979, showing the overall declining trend with global warming and the record set in 2012.
As well as its expanse of sea ice, the Arctic is home to the Greenland Ice Sheet, the planet’s largest mass of ice outside of Antarctica. (If it were to melt in one go, sea levels would rise by about 24 feet.)
The Greenland Ice Sheet, too, melts during the summer, and 2012 was again a record year.
Tracking the ice sheet’s annual rise and fall is harder than monitoring sea ice, but the chart below shows an estimate of the balance between melting and new ice forming from snow, calculated from climate and weather forecast models by Xavier Fettweis, a climate scientist at the University of Liège in Belgium.
Hover or tap on the chart to compare 2012 and 2019; other years from 1979 onward are shown in light gray.
This chart shows the change in ice mass from Sept. 1 each year, as snow and ice accumulates through the fall and winter before the spring and summer melt kicks in. As for sea ice, 2019 is tracking close to 2012 for a record melt.
“For Greenland, I think we are going to see a fairly significant continuing melt through August,” Ted Scambos of the National Snow and Ice Data Center told BuzzFeed News.
Looking at the chart above, you might think that the overall size of the Greenland Ice Sheet is growing from year to year. It’s not, because Fettweis’s estimates don’t account for ice breaking off from the sheet to form icebergs where Greenland’s glaciers meet the sea.
Factor in that process, and the Greenland Ice Sheet is clearly shrinking with global warming. According to measurements made by NASA’s GRACE satellites, estimating the mass of ice from variations in Earth’s gravity field, Greenland lost its ice at a rate of about 280 gigatons per year between 2002 and 2016.
View this video on YouTube
Whether or not 2019 sets new records for summer melt in the Arctic, that trend is set to continue. “We still don’t know how bad it can get,” Christopher Polashenski, a geophysicist with the US Army Corps of Engineers’ Cold Regions Research and Engineering Laboratory in Hanover, New Hampshire, told BuzzFeed News.
Read more
- Here And Now: These Maps Show How Climate Change Has Already Transformed The EarthPeter Aldhous · April 22, 2019
- Arctic Sea Ice Is Freakishly Low Right NowDino Grandoni · Nov. 19, 2016
- Climate Change
Peter Aldhous is a Science Reporter for BuzzFeed News and is based in San Francisco.
Contact Peter Aldhous at [email protected].
Got a confidential tip? Submit it here.
Source: Read Full Article


